生活不易、且行且珍惜。网站首页 程序人生
使用百度图表ECharts
发布时间:2019-07-12 09:33编辑:zj 阅读: 文章分类:
开发互动QQ群:170915747
文章分类:
开发互动QQ群:170915747
百度图表已经用过好几次了,但是今天准备把博客的访问情况可视化的时候发现,又得去官网看文档做。 有些还要找,所以记录一下,毕竟这玩意用的比较多。
一共做了3个比较简单的图表(复杂的可以很复杂,还是得去官网看文档),效果图:

首先呢,从源码包中拷贝echarts.min.js到项目中,然后写放图表的div。
<div id="chart1">
    <!-- 为 ECharts 准备一个具备大小(宽高)的 DOM -->
    <div id="main" style="width: 720px;height:400px;"></div>
    <div id="main2" style="width: 720px;height:400px;"></div>
    <div id="main3" style="width: 720px;height:400px;"></div>
</div>
js生成图表,利用ajax请求展示动态数据。
<script>
// 基于准备好的dom,初始化echarts实例
var myChart = echarts.init(document.getElementById('main'));
var myChart2 = echarts.init(document.getElementById('main2'));
var myChart3 = echarts.init(document.getElementById('main3'));
//图表数据还未加载,显示等待loading
myChart.showLoading();
myChart2.showLoading();
myChart3.showLoading();
$.ajax({
url:'getChartData',
type:'get',
dataType:'json',
success:function(data){
console.log(data)
// 指定图表的配置项和数据
var option = {
title: {
text: '博客最近一周访问量' + data.chart1TotalCount //标题
},
tooltip: {},
legend: {
data:['PV'] //图表上方注释
},
xAxis: {
type: 'category',
data: data.chart1X, //x轴数据
axisTick: {
alignWithLabel: true,
interval:0
},
axisLabel: {
interval:0,
align:'center'
}
},
yAxis: {type: 'value'}, //y轴显示数据
series: [{
name: 'PV', //数据名
stack:"count",
type: 'line', //line折线/bar柱状
data: data.chart1Y, //数据
itemStyle: { //加了这个显示图标中的数据或者设置样式
normal: {
label: {
show: true, //开启显示
position: 'top', //在上方显示
textStyle: { //数值样式
color: 'black',
fontSize: 16
},
formatter: function (params) {
if (params.value > 0) {
return params.value;
} else {
return '';
}
}
}
}
}
}]
};
myChart.hideLoading();//加载图表数据,隐藏等待loading图表
// 使用刚指定的配置项和数据显示图表。
myChart.setOption(option);
var option2 = {
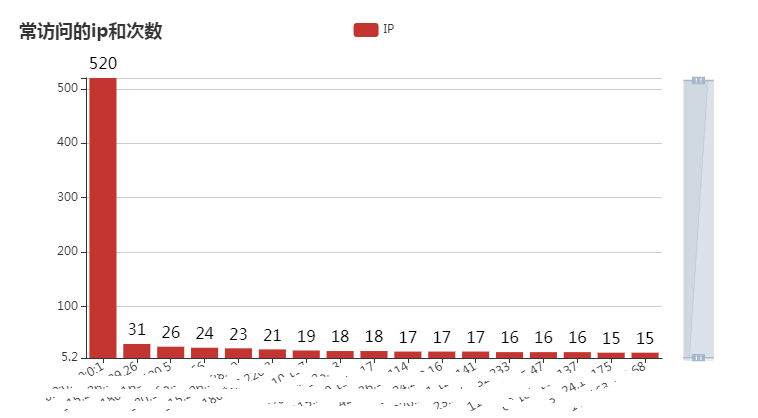
title: {
text: '常访问的ip和次数'
},
tooltip: {},
legend: {
data:['IP']
},
xAxis: {
type: 'category',
data: data.chart2X,
axisTick: {
alignWithLabel: true,
interval:0
},
axisLabel: {
interval:0,
rotate:30 //x轴显示不下文字,选择倾斜
}
},
yAxis: {type: 'value'},
//dataZoom
dataZoom: [
{
type: 'slider', //控制x轴,滚轮滚动
show: false, //是否显示滚轮
xAxisIndex: [0],
start: 1, //默认开始位置:1%
end: 100 //默认结束位置:100%
},
{
type: 'slider', //控制y轴,滚轮滚动
show: true,
yAxisIndex: [0],
left: '93%',
start: 1,
end: 100
},
{
type: 'inside', //控制x轴,坐标轴内可滚动
xAxisIndex: [0],
start: 1,
end: 100
},
{
type: 'inside', //控制y轴,坐标轴内可滚动
yAxisIndex: [0],
start: 1,
end: 100
}
],
series: [{
name: 'IP',
stack:"count",
type: 'bar',
data: data.chart2Y,
itemStyle: {
normal: {
label: {
show: true, //开启显示
position: 'top', //在上方显示
textStyle: { //数值样式
color: 'black',
fontSize: 16
},
formatter: function (params) {
if (params.value > 0) {
return params.value;
} else {
return '';
}
}
}
}
}
}]
};
// 使用刚指定的配置项和数据显示图表。
myChart2.hideLoading();
myChart2.setOption(option2);
var option3 = {
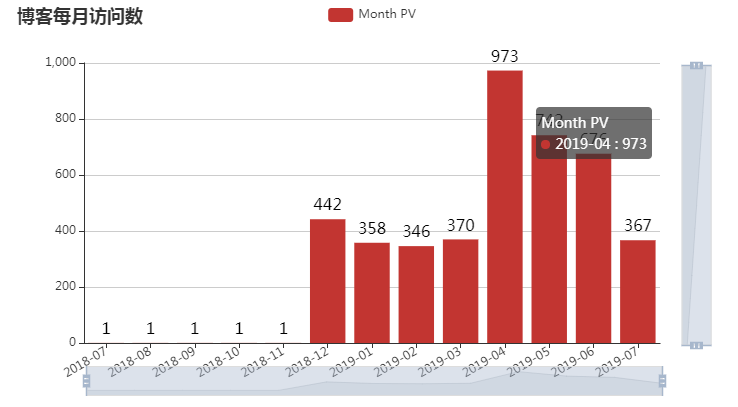
title: {
text: '博客每月访问数'
},
tooltip: {},
legend: {
data:['Month PV']
},
xAxis: {
type: 'category',
data: data.chart3X,
axisTick: {
alignWithLabel: true,
interval:0
},
axisLabel: {
interval:0,
rotate:30
}
},
yAxis: {type: 'value'},
dataZoom: [
{
type: 'slider',
show: true,
xAxisIndex: [0],
start: 1,
end: 100
},
{
type: 'slider',
show: true,
yAxisIndex: [0],
left: '93%',
start: 1,
end: 100
},
{
type: 'inside',
xAxisIndex: [0],
start: 1,
end: 100
},
{
type: 'inside',
yAxisIndex: [0],
start: 1,
end: 100
}
],
series: [{
name: 'Month PV',
stack:"count",
type: 'bar',
data: data.chart3Y,
itemStyle: {
normal: {
label: {
show: true, //开启显示
position: 'top', //在上方显示
textStyle: { //数值样式
color: 'black',
fontSize: 16
},
formatter: function (params) {
if (params.value > 0) {
return params.value;
} else {
return '';
}
}
}
}
}
}]
};
// 使用刚指定的配置项和数据显示图表。
myChart3.hideLoading();
myChart3.setOption(option3);
}
});
//给图表添加点击事件,点击折现转点或柱状图的内容,可以根据自己的需求定义方法
myChart.on('click', function (param) {
$.ajax({
url:'getDataByDate',
type:'post',
data:{'date':param.name},
success:function(data){
console.log(data);
}
});
});
myChart2.on('click', function (param) {
window.location.href="getDat"
});
myChart3.on('click', function (param) {
window.location.href="getDat"
});
</script>Java代码:查询出表数据,传到前端和图表点击事件的后台方法
@RequestMapping({"/getDataChart"})
    @ResponseBody
    public Map<String, Object> getDataChart() {
        List<VisitorCounter> recentList = visitorCounterService.selectListDays();
        List<VisitorCounter> list = visitorCounterService.selectAll();
        Map<String, Integer> countMap = new HashMap<String, Integer>();
        Map<String, Integer> countIpMap = new HashMap<String, Integer>();
        Map<String, Integer> countMonthMap = new HashMap<String, Integer>();
        recentList.stream().forEach(e -> {
            String dayNow = new SimpleDateFormat("MM-dd").format(e.getvDate());
            countMap.put(dayNow, Tools.isEmpty(countMap.get(dayNow)) ? 1 : countMap.get(dayNow) + 1);
        });

        list.stream().forEach(e -> {
            String MonthNow = new SimpleDateFormat("yyyy-MM").format(e.getvDate());
            countIpMap.put(e.getIp(), Tools.isEmpty(countIpMap.get(e.getIp())) ? 1 : countIpMap.get(e.getIp()) + 1);
            countMonthMap.put(MonthNow,
                Tools.isEmpty(countMonthMap.get(MonthNow)) ? 1 : countMonthMap.get(MonthNow) + 1);
        });

        Map<String, Object> map = new HashMap<String, Object>();

        // 最近七日每天的访问数
        Map<String, Integer> countViewMap = sortMapByKey(countMap, true);
        int chart1TotalCount = 0;
        List<String> chart1X = new ArrayList<String>();
        List<Integer> chart1Y = new ArrayList<Integer>();
        for (String key : countViewMap.keySet()) {
            chart1X.add(key);
            chart1Y.add(countViewMap.get(key));
            chart1TotalCount += countViewMap.get(key);
        }
        map.put("chart1X", chart1X);
        map.put("chart1Y", chart1Y);
        map.put("chart1TotalCount", chart1TotalCount);

        // 历史访问前18位的ip和访问次数
        Map<String, Integer> countIpViewMap = sortMapByValueInteger(countIpMap, false);
        List<String> chart2X = new ArrayList<String>();
        List<Integer> chart2Y = new ArrayList<Integer>();
        for (String key : countIpViewMap.keySet()) {
            chart2X.add(key);
            chart2Y.add(countIpViewMap.get(key));
        }
        map.put("chart2X", chart2X);
        map.put("chart2Y", chart2Y);

        // 历史每月的访问量
        Map<String, Integer> countMonthViewMap = sortMapByKey(countMonthMap, true);
        List<String> chart3X = new ArrayList<String>();
        List<Integer> chart3Y = new ArrayList<Integer>();
        for (String key : countMonthViewMap.keySet()) {
            chart3X.add(key);
            chart3Y.add(countMonthViewMap.get(key));
        }
        map.put("chart3X", chart3X);
        map.put("chart3Y", chart3Y);

        System.out.println(map);
        return map;
    }

    @RequestMapping({"/getDataChartsByDate"})
    public String getDataChartsByDate(Model model, String date, String type) throws ParseException {

        VisitorCounter vistorCounter = new VisitorCounter();

        // Date now = new SimpleDateFormat("yyyy-MM-dd").parse(yearNow + "-" + date);
        String time = null;
        if ("y".equals(type)) {
            time = date;
        } else {
            String yearNow = new SimpleDateFormat("yyyy").format(new Date());
            time = yearNow + "-" + date;
        }

        vistorCounter.setIp(time);
        List<VisitorCounter> recentList = visitorCounterService.selectListByDate(vistorCounter);
        model.addAttribute("list", recentList);
        model.addAttribute("time", time);
        model.addAttribute("count", recentList.size());
        return "ht/showCount";
    }
#去评论一下
标签:#前端
版权声明:本博客的所有原创内容皆为作品作者所有
转载请注明:来自ZJBLOG 链接:www.zjhuiwan.cn
 +1
+1
「万物皆有时,比如你我相遇」

感谢大佬打赏【请选择支付宝或微信,再选择金额】
使用微信扫描二维码完成支付